Kubernetes Logs (DEPRECATED) (FREE)
- Introduced in GitLab 11.0.
- Moved from GitLab Ultimate to GitLab Free 12.9.
- Deprecated in GitLab 14.5.
WARNING: This feature was deprecated in GitLab 14.5.
GitLab makes it easy to view the logs of running pods in connected Kubernetes clusters. By displaying the logs directly in GitLab in the Log Explorer, developers can avoid managing console tools or jumping to a different interface. The Log Explorer interface provides a set of filters above the log file data, depending on your configuration:
-
Namespace - Select the environment to display. Users with Maintainer or
greater permissions can also see pods in the
gitlab-managed-appsnamespace. - Search - Only available if the Elastic Stack integration is enabled.
- Select time range - Select the range of time to display. Only available if the Elastic Stack integration is enabled.
- Scroll to bottom {scroll_down} - Scroll to the end of the displayed logs.
- Refresh {retry} - Reload the displayed logs.
To learn more about the Log Explorer, see APM - Log Explorer.
Learn more about Kubernetes + GitLab. Everything you need to build, test, deploy, and run your application at scale.
Requirements
Deploying to a Kubernetes environment is required to use Logs.
Accessing the log explorer
To access the Log explorer, click the More actions {ellipsis_v} menu on a metrics dashboard and select View logs, or:
-
Sign in as a user with the View pod logs permissions in the project.
-
To navigate to the Log Explorer from the sidebar menu, go to Monitor > Logs (Introduced in GitLab 12.5.).
-
To navigate to the Log Explorer from a specific pod on a deploy board:
- Go to Deployments > Environments and find the environment
which contains the desired pod, like
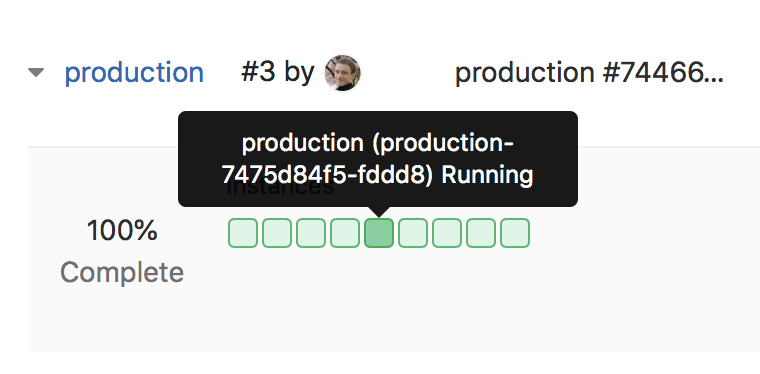
production. - On the Environments page, you should see the status of the environment's pods with deploy boards.
- When mousing over the list of pods, GitLab displays a tooltip with the exact pod name
and status.

- Click on the desired pod to display the Log Explorer.
- Go to Deployments > Environments and find the environment
which contains the desired pod, like
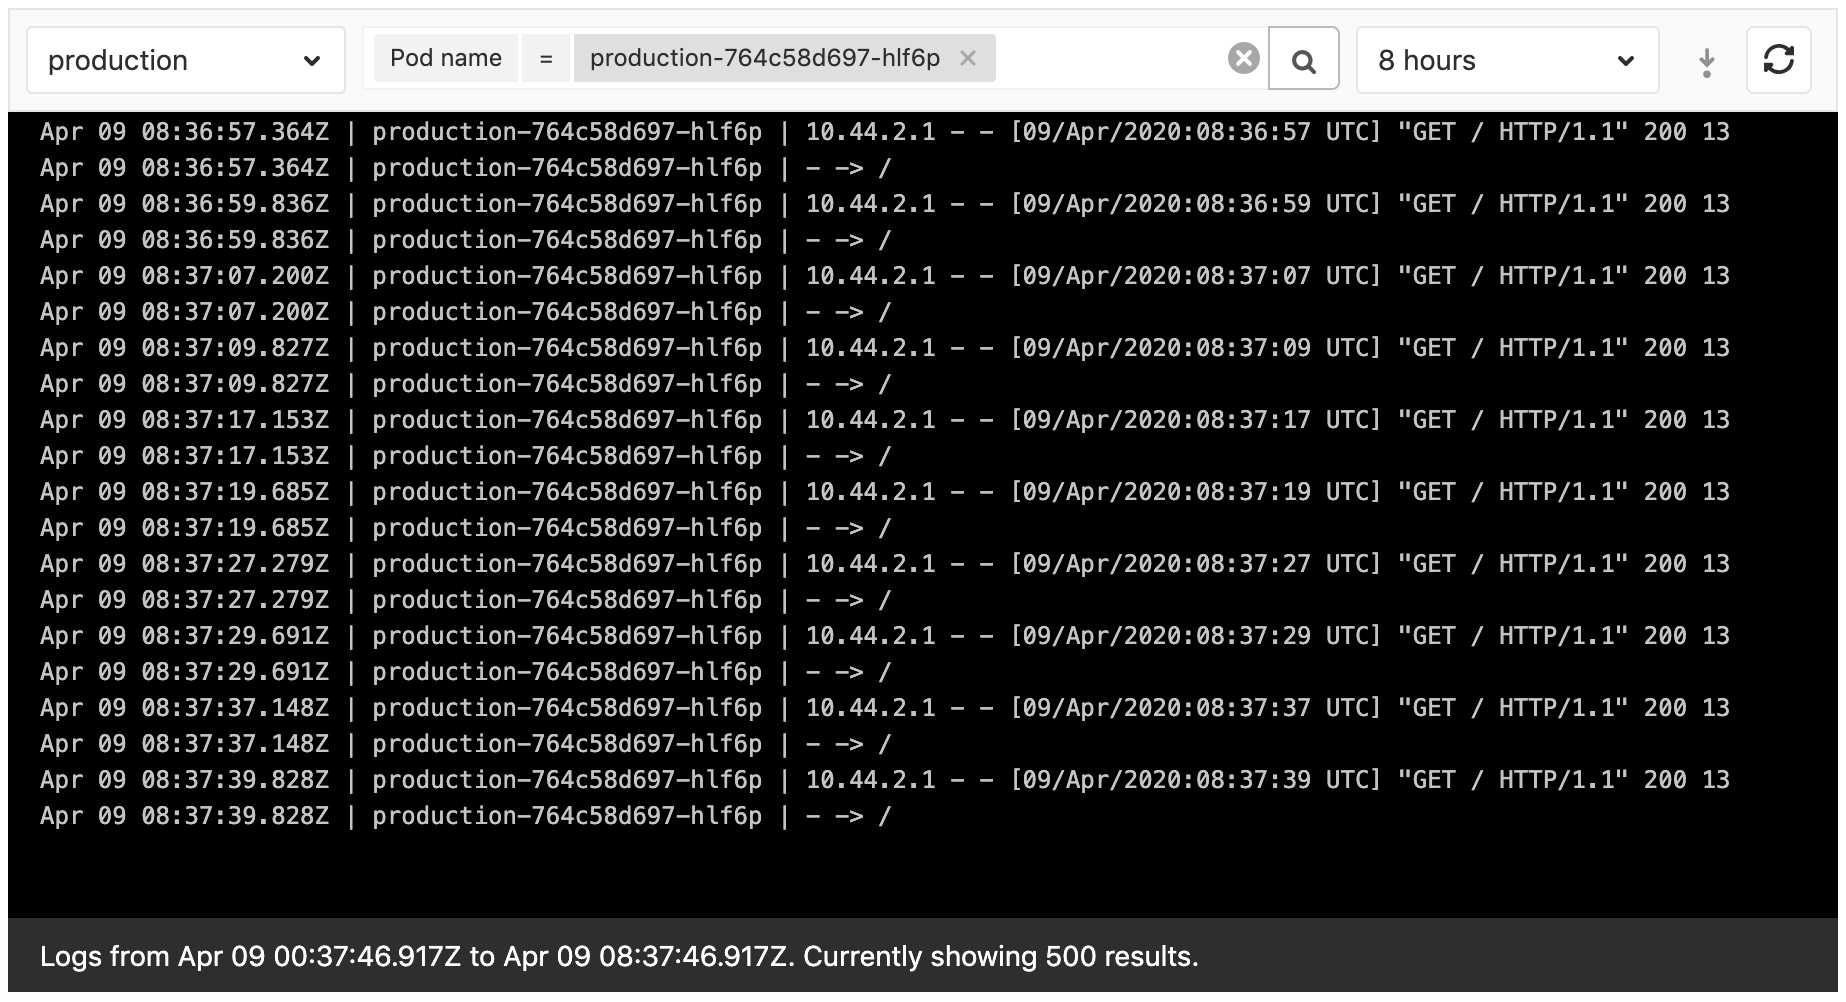
Logs view
The Log Explorer lets you filter the logs by:
- Pods.
- From GitLab 12.4, environments.
- From GitLab 12.7, full text search.
- From GitLab 12.8, dates.
- From GitLab 13.2, managed apps.
Loading more than 500 log lines is possible from GitLab 12.9 onward.
Support for pods with multiple containers is coming in a future release.
Support for historical data is coming in a future release.
Filter by date
Introduced in GitLab 12.8.
When you enable Elastic Stack on your cluster, you can filter logs displayed in the Log Explorer by date.
Click Show last in the Log Explorer to see the available options.
Full text search
Introduced in GitLab 12.7.
When you enable Elastic Stack on your cluster, you can search the content of your logs through a search bar. The search is passed to Elasticsearch using the simple_query_string Elasticsearch function, which supports the following operators:
| Operator | Description |
|---|---|
| |
An OR operation. |
- |
Negates a single token. |
+ |
An AND operation. |
" |
Wraps a number of tokens to signify a phrase for searching. |
* (at the end of a term) |
A prefix query. |
( and )
|
Precedence. |
~N (after a word) |
Edit distance (fuzziness). |
~N (after a phrase) |
Slop amount. |