Test coverage visualization (FREE)
- Introduced in GitLab 12.9.
- Feature flag removed in GitLab 13.5.
With the help of GitLab CI/CD, you can collect the test coverage information of your favorite testing or coverage-analysis tool, and visualize this information inside the file diff view of your merge requests (MRs). This will allow you to see which lines are covered by tests, and which lines still require coverage, before the MR is merged.
How test coverage visualization works
Collecting the coverage information is done via GitLab CI/CD's artifacts reports feature. You can specify one or more coverage reports to collect, including wildcard paths. GitLab then takes the coverage information in all the files and combines it together. Coverage files are parsed in a background job so there can be a delay between pipeline completion and the visualization loading on the page.
For the coverage analysis to work, you have to provide a properly formatted
Cobertura XML report to
artifacts:reports:cobertura.
This format was originally developed for Java, but most coverage analysis frameworks
for other languages have plugins to add support for it, like:
- simplecov-cobertura (Ruby)
- gocover-cobertura (Golang)
Other coverage analysis frameworks support the format out of the box, for example:
- Istanbul (JavaScript)
- Coverage.py (Python)
- PHPUnit (PHP)
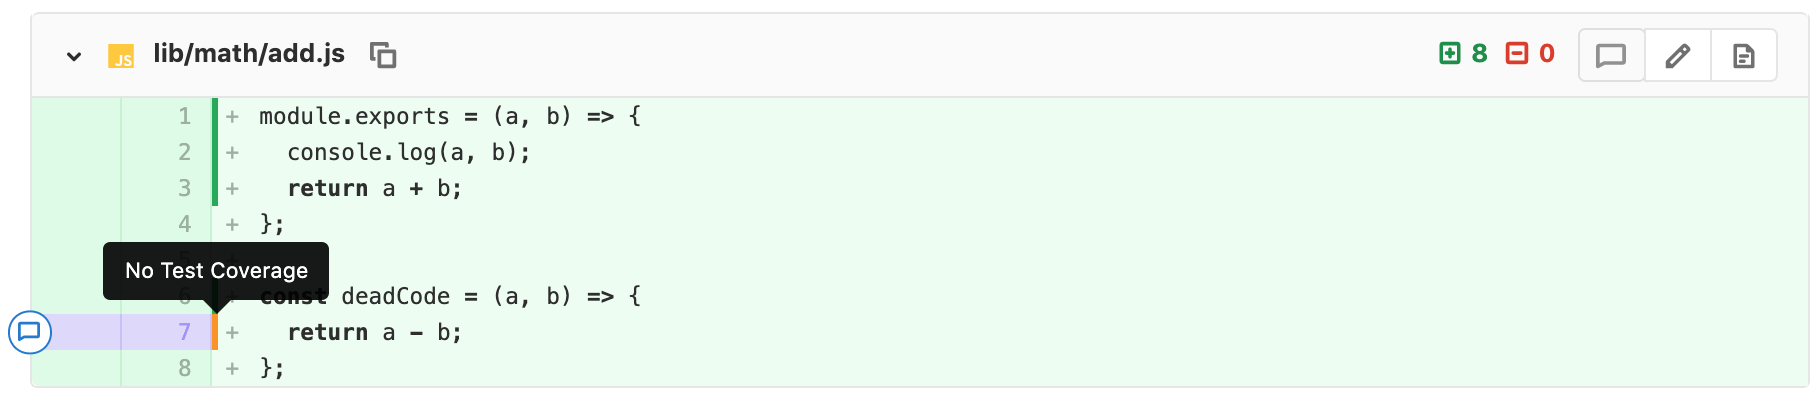
Once configured, if you create a merge request that triggers a pipeline which collects coverage reports, the coverage is shown in the diff view. This includes reports from any job in any stage in the pipeline. The coverage displays for each line:
-
covered(green): lines which have been checked at least once by tests -
no test coverage(orange): lines which are loaded but never executed - no coverage information: lines which are non-instrumented or not loaded
Hovering over the coverage bar provides further information, such as the number of times the line was checked by tests.
Uploading a test coverage report does not enable:
You must configure these separately.
Limits
A limit of 100 <source> nodes for Cobertura format XML files applies. If your Cobertura report exceeds
100 nodes, there can be mismatches or no matches in the merge request diff view.
A single Cobertura XML file can be no more than 10MiB. For large projects, split the Cobertura XML into smaller files. See this issue for more details. When submitting many files, it can take a few minutes for coverage to show on a merge request.
Artifact expiration
By default, the pipeline artifact used to draw the visualization on the merge request expires one week after creation.
Automatic class path correction
- Introduced in GitLab 13.8.
- Feature flag removed in GitLab 13.9.
The coverage report properly matches changed files only if the filename of a class element
contains the full path relative to the project root. However, in some coverage analysis frameworks,
the generated Cobertura XML has the filename path relative to the class package directory instead.
To make an intelligent guess on the project root relative class path, the Cobertura XML parser
attempts to build the full path by:
- Extracting a portion of the
sourcepaths from thesourceselement and combining them with the classfilenamepath. - Checking if the candidate path exists in the project.
- Using the first candidate that matches as the class full path.
Path correction example
As an example, a project with:
-
A full path of
test-org/test-project. -
The following files relative to the project root:
Auth/User.cs
Lib/Utils/User.cs
src/main/java
In the:
-
Cobertura XML, the
filenameattribute in theclasselement assumes the value is a relative path to the project's root:<class name="packet.name" filename="src/main/java" line-rate="0.0" branch-rate="0.0" complexity="5"> -
sourcesfrom Cobertura XML, the following paths in the format<CI_BUILDS_DIR>/<PROJECT_FULL_PATH>/...:<sources> <source>/builds/test-org/test-project/Auth</source> <source>/builds/test-org/test-project/Lib/Utils</source> </sources>
The parser:
- Extracts
AuthandLib/Utilsfrom thesourcesand uses these to determine theclasspath relative to the project root. - Combines these extracted
sourcesand the class filename. For example, if there is aclasselement with thefilenamevalue ofUser.cs, the parser takes the first candidate path that matches, which isAuth/User.cs. - For each
classelement, attempts to look for a match for each extractedsourcepath up to 100 iterations. If it reaches this limit without finding a matching path in the file tree, the class is not included in the final coverage report.
NOTE:
Automatic class path correction only works on source paths in the format <CI_BUILDS_DIR>/<PROJECT_FULL_PATH>/....
The source is ignored if the path does not follow this pattern. The parser assumes that the
filename of a class element contains the full path relative to the project root.
Example test coverage configurations
This section provides test coverage configuration examples for different programming languages. You can also see a working example in
the coverage-report demonstration project.
JavaScript example
The following .gitlab-ci.yml example uses Mocha
JavaScript testing and nyc coverage-tooling to
generate the coverage artifact:
test:
  script:
    - npm install
    - npx nyc --reporter cobertura mocha
  artifacts:
    reports:
      coverage_report:
        coverage_format: cobertura
        path: coverage/cobertura-coverage.xml
Java and Kotlin examples
Maven example
The following .gitlab-ci.yml example for Java or Kotlin uses Maven
to build the project and JaCoCo coverage-tooling to
generate the coverage artifact.
You can check the Docker image configuration and scripts if you want to build your own image.
GitLab expects the artifact in the Cobertura format, so you have to execute a few
scripts before uploading it. The test-jdk11 job tests the code and generates an
XML artifact. The coverage-jdk-11 job converts the artifact into a Cobertura report:
test-jdk11:
  stage: test
  image: maven:3.6.3-jdk-11
  script:
    - mvn $MAVEN_CLI_OPTS clean org.jacoco:jacoco-maven-plugin:prepare-agent test jacoco:report
  artifacts:
    paths:
      - target/site/jacoco/jacoco.xml

coverage-jdk11:
  # Must be in a stage later than test-jdk11's stage.
  # The `visualize` stage does not exist by default.
  # Please define it first, or choose an existing stage like `deploy`.
  stage: visualize
  image: registry.gitlab.com/haynes/jacoco2cobertura:1.0.7
  script:
    # convert report from jacoco to cobertura, using relative project path
    - python /opt/cover2cover.py target/site/jacoco/jacoco.xml $CI_PROJECT_DIR/src/main/java/ > target/site/cobertura.xml
  needs: ["test-jdk11"]
  artifacts:
    reports:
      cobertura: target/site/cobertura.xml
Gradle example
The following .gitlab-ci.yml example for Java or Kotlin uses Gradle
to build the project and JaCoCo coverage-tooling to
generate the coverage artifact.
You can check the Docker image configuration and scripts if you want to build your own image.
GitLab expects the artifact in the Cobertura format, so you have to execute a few
scripts before uploading it. The test-jdk11 job tests the code and generates an
XML artifact. The coverage-jdk-11 job converts the artifact into a Cobertura report:
test-jdk11:
  stage: test
  image: gradle:6.6.1-jdk11
  script:
    - 'gradle test jacocoTestReport' # jacoco must be configured to create an xml report
  artifacts:
    paths:
      - build/jacoco/jacoco.xml

coverage-jdk11:
  # Must be in a stage later than test-jdk11's stage.
  # The `visualize` stage does not exist by default.
  # Please define it first, or chose an existing stage like `deploy`.
  stage: visualize
  image: registry.gitlab.com/haynes/jacoco2cobertura:1.0.7
  script:
    # convert report from jacoco to cobertura, using relative project path
    - python /opt/cover2cover.py build/jacoco/jacoco.xml $CI_PROJECT_DIR/src/main/java/ > build/cobertura.xml
  needs: ["test-jdk11"]
  artifacts:
    reports:
      cobertura: build/cobertura.xml
Python example
The following .gitlab-ci.yml example for Python uses pytest-cov to collect test coverage data and coverage.py to convert the report to use full relative paths.
The information isn't displayed without the conversion.
This example assumes that the code for your package is in src/ and your tests are in tests.py:
run tests:
  stage: test
  image: python:3
  script:
    - pip install pytest pytest-cov
    - coverage run -m pytest
    - coverage report
    - coverage xml
  artifacts:
    reports:
      cobertura: coverage.xml
PHP example
The following .gitlab-ci.yml example for PHP uses PHPUnit
to collect test coverage data and generate the report.
With a minimal phpunit.xml file (you may reference
this example repository), you can run the test and
generate the coverage xml:
run tests:
  stage: test
  image: php:latest
  variables:
    XDEBUG_MODE: coverage
  before_script:
    - apt-get update && apt-get -yq install git unzip zip libzip-dev zlib1g-dev
    - docker-php-ext-install zip
    - pecl install xdebug && docker-php-ext-enable xdebug
    - php -r "copy('https://getcomposer.org/installer', 'composer-setup.php');"
    - php composer-setup.php --install-dir=/usr/local/bin --filename=composer
    - composer install
    - composer require --dev phpunit/phpunit phpunit/php-code-coverage
  script:
    - php ./vendor/bin/phpunit --coverage-text --coverage-cobertura=coverage.cobertura.xml
  artifacts:
    reports:
cobertura: coverage.cobertura.xmlCodeception, through PHPUnit, also supports generating Cobertura report with
run. The path for the generated file
depends on the --coverage-cobertura option and paths
configuration for the unit test suite. Configure .gitlab-ci.yml
to find Cobertura in the appropriate path.
C/C++ example
The following .gitlab-ci.yml example for C/C++ with
gcc or g++ as the compiler uses gcovr to generate the coverage
output file in Cobertura XML format.
This example assumes:
- That the
Makefileis created bycmakein thebuilddirectory, within another job in a previous stage. (If you useautomaketo generate theMakefile, then you need to callmake checkinstead ofmake test.) -
cmake(orautomake) has set the compiler option--coverage.
run tests:
  stage: test
  script:
    - cd build
    - make test
    - gcovr --xml-pretty --exclude-unreachable-branches --print-summary -o coverage.xml --root ${CI_PROJECT_DIR}
  coverage: /^\s*lines:\s*\d+.\d+\%/
  artifacts:
    name: ${CI_JOB_NAME}-${CI_COMMIT_REF_NAME}-${CI_COMMIT_SHA}
    expire_in: 2 days
    reports:
      cobertura: build/coverage.xml
Go example
The following .gitlab-ci.yml example for Go uses:
-
go testto run tests. -
gocover-coberturato convert Go's coverage profile into the Cobertura XML format.
This example assumes that Go modules
are being used. Please note that the -covermode count option does not work with the -race flag.
If you want to generate code coverage while also using the -race flag, you must switch to
-covermode atomic which is slower than -covermode count. See this blog post
for more details.
run tests:
  stage: test
  image: golang:1.17
  script:
    - go install
    - go test ./... -coverprofile=coverage.txt -covermode count
    - go get github.com/boumenot/gocover-cobertura
    - go run github.com/boumenot/gocover-cobertura < coverage.txt > coverage.xml
  artifacts:
    reports:
      cobertura: coverage.xml
Ruby example
The following .gitlab-ci.yml example for Ruby uses
-
rspecto run tests. -
simplecovandsimplecov-coberturato record the coverage profile and create a report in the Cobertura XML format.
This example assumes:
- That
bundleris being used for dependency management. Therspec,simplecovandsimplecov-coberturagems have been added to yourGemfile. - The
CoberturaFormatterhas been added to yourSimpleCov.formattersconfiguration within thespec_helper.rbfile.
run tests:
  stage: test
  image: ruby:3.1
  script:
    - bundle install
    - bundle exec rspec
  artifacts:
    reports:
      cobertura: coverage/coverage.xml