Prometheus integration (FREE)
GitLab offers powerful integration with Prometheus for monitoring key metrics of your apps, directly in GitLab. Metrics for each environment are retrieved from Prometheus, and then displayed in the GitLab interface.
There are two ways to set up Prometheus integration, depending on where your apps are running:
- For deployments on Kubernetes, GitLab can be integrated with an in-cluster Prometheus
- For other deployment targets, specify the Prometheus server.
Once enabled, GitLab detects metrics from known services in the metric library. You can also add your own metrics and create custom dashboards.
Enabling Prometheus Integration
Prometheus cluster integration
- Introduced in GitLab 13.11.
- Replaced the Prometheus cluster applications in GitLab 14.0.
GitLab can query an in-cluster Prometheus for your metrics. See Prometheus cluster integration for details.
Manual configuration of Prometheus
Requirements
Integration with Prometheus requires the following:
- Prometheus must be configured to collect one of the supported metrics
- Each metric must have a label to indicate the environment
- GitLab must have network connectivity to the Prometheus server
Getting started
Installing and configuring Prometheus to monitor applications is fairly straightforward.
- Install Prometheus
- Set up one of the supported monitoring targets
- Configure the Prometheus server to collect their metrics
Configuration in GitLab
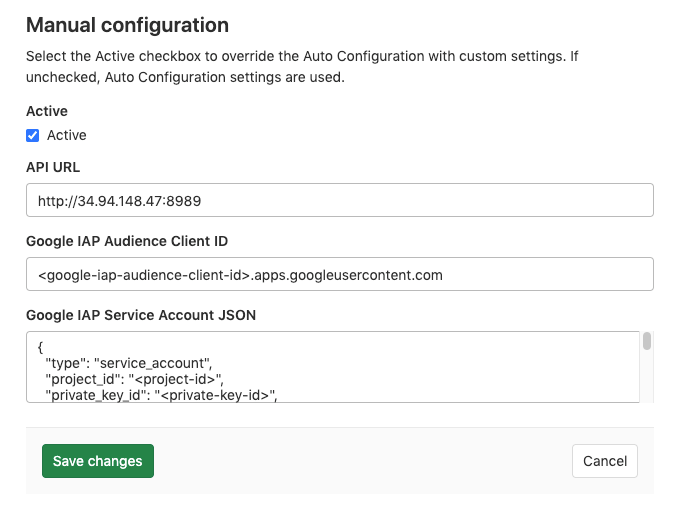
The actual configuration of Prometheus integration in GitLab requires the domain name or IP address of the Prometheus server you'd like to integrate with. If the Prometheus resource is secured with Google's Identity-Aware Proxy (IAP), you can pass information like Client ID and Service Account credentials. GitLab can use these to access the resource. More information about authentication from a service account can be found at Google's documentation for Authenticating from a service account.
- On the top bar, select Menu > Projects and find your project.
- On the left sidebar, select Settings > Integrations.
- Select Prometheus.
- For API URL, provide the domain name or IP address of your server, such as
http://prometheus.example.com/orhttp://192.0.2.1/. - (Optional) In Google IAP Audience Client ID, provide the Client ID of the Prometheus OAuth Client secured with Google IAP.
- (Optional) In Google IAP Service Account JSON, provide the contents of the
Service Account credentials file that is authorized to access the Prometheus resource.
The JSON key
token_credential_uriis discarded to prevent Server-side Request Forgery (SSRF). - Select Save changes.
Thanos configuration in GitLab
You can configure Thanos as a drop-in replacement for Prometheus with GitLab. Use the domain name or IP address of the Thanos server you'd like to integrate with.
- On the top bar, select Menu > Projects and find your project.
- On the left sidebar, select Settings > Integrations.
- Select Prometheus.
- Provide the domain name or IP address of your server, for example
http://thanos.example.com/orhttp://192.0.2.1/. - Select Save changes.
Precedence with multiple Prometheus configurations
Although you can enable both a manual configuration and cluster integration of Prometheus, you can use only one:
- If you have enabled a Prometheus manual configuration and a Prometheus cluster integration, the manual configuration takes precedence and is used to run queries from custom dashboards and custom metrics.
- If you have managed Prometheus applications installed on Kubernetes clusters at different levels (project, group, instance), the order of precedence is described in Cluster precedence.
- If you have managed Prometheus applications installed on multiple Kubernetes clusters at the same level, the Prometheus application of a cluster with a matching environment scope is used.
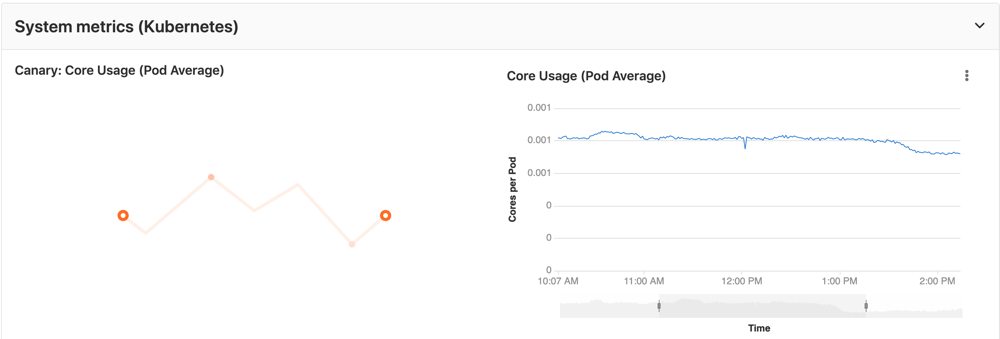
Determining the performance impact of a merge
Developers can view the performance impact of their changes in the merge request workflow. This feature requires Kubernetes metrics.
When a source branch has been deployed to an environment, a sparkline and numeric comparison of the average memory consumption displays. On the sparkline, a dot indicates when the current changes were deployed, with up to 30 minutes of performance data displayed before and after. The comparison shows the difference between the 30 minute average before and after the deployment. This information is updated after each commit has been deployed.
Once merged and the target branch has been redeployed, the metrics switches to show the new environments this revision has been deployed to.
Performance data is available for the duration it is persisted on the Prometheus server.
